Global Emerging Markets Update - August 2020
18 September 2020
Market Review
Up we go again. The COVID-19 sell off, which saw the MSCI EM US$ index collapse -24% over the 1Q 2020 has been virtually erased by the recovery in markets over April through August. The past month saw the EM US$ index rise +2%, which now means the index is down just -1% 2020 YTD. The US$ DM index rose a robust +7% over August, totally erasing the COVID-led decline, as such DM index is now up +5% YTD (see Table 2). The DM index was driven by another strong month in US technology heavyweights (the FANGMAN cohort, plus Telsa).
The August EM index positive performance was again posted despite rising COVID-19 cases, especially in India (+123% MoM to 3.8m), Indonesia (+62% MoM to 0.2m), Brazil (+44% MoM to 3.9m) and Mexico (42% MoM to 0.6m). As with DM, investors are still looking through the COVID-19 disruption (even “second wave” risks) and focusing on the massive whatever-it-takes stimulus programs, which are providing a floor to markets. Market sentiment is also being assisted by:
- Economic recovery appears to be taking hold as countries exit lockdowns to various degrees, reflected in improving monthly PMI data.
- June quarter company profits have been released and were not as dire as expected (or feared), and some cases – mainly related to technology – were considerably above consensus.
- The continued weakness in the USD (DXY index fell -1% over August, down -10% from its March peak), in part reflects the Trump administration’s very poor policy response to COVID-19, as well as the unprecedented monetary stimulus by the Fed, and commitment for “lower for longer” policy rates. This has also assisted asset allocation away from USD securities and into EM debt and equity capital markets.
- China’s post COVID economic recovery continues to fuel commodity price rises over August: iron ore +17% (up +44% YTD), industrial metals +5% (+6% YTD) and WTI crude up +6% (-29% YTD) also boosted performance for countries like Russia.
In the wake of the global COVID-19 economic slump, and associated negative impact of global supply chains, tourism and export demand – we have seen profound central bank easing. Indeed, the breadth of central bank easing across global capital markets is totally unprecedented with a net 149 policy rate cuts over the past 7 months alone, since COVID-19 became a pandemic – see chart (black bars).
Policy Rate Changes (Net number of Country Changes = Hike – Cut)
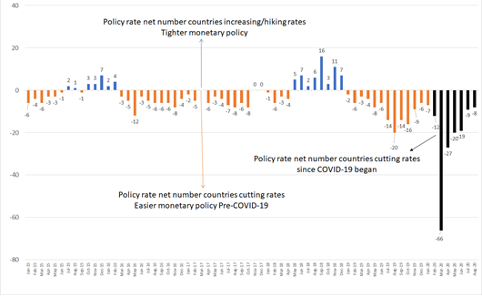
However, with central bank policy rates now so low, the frequency of plain vanilla cuts is obviously slowing as lower bound limits are reached. This has brought on more unconventional stimulus programs.
As such, widespread policy rate cuts have been matched by equally aggressive bouts of money printing (referred to as quantitative easing, QE) and new fiscal policies (including direct loans to companies, and substantially increased unemployment benefits). The aggressive policy response to COVID-19, especially QE, continues to be led by the US, Europe, Japan and many other developed markets.However, with central bank policy rates now so low, the frequency of plain vanilla cuts is obviously slowing as lower bound limits are reached. This has brought on more unconventional stimulus programs.
Away from rate cuts, EM policy initiatives in terms of GDP continue to be comparatively restrained. We continue to reiterate that EM central banks are very mindful of potential currency vulnerabilities if they attempt aggressive QE – without “reserve” currencies. Additionally, many EM governments have a general commitment to conservative fiscal policy (some dictated by legislation), typically a result of past experiences during episodes of economic/fiscal crises. In sum, this has led to a much milder monetary and fiscal response from EM to the economic shock of COVID-19 relative to DM.
G20 Fiscal Response to COVID-19 (% of GDP)
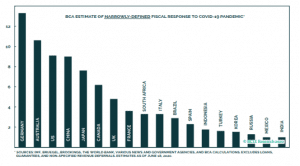
Source: BCA, IMF
With limited unemployment benefits and inability to control social distancing for sustained periods, EM’s working population will go back to work almost by necessity – otherwise there is a risk of widespread unrest/rioting. Further, given EMs’ much younger populations (median age 28) the death rate would seem to be materially lower in any case at this stage, given approximately 97% of COVID-19 deaths occur in people over 55 years and 75% above 70 years (Source: US Centres for Disease Control and Prevention).
Accordingly, despite rising cases and tragic deaths, lockdowns have materially eased across most EM countries. Even the worst hit COVID-19 countries of Brazil, Mexico and India continue to exit lockdowns. Whilst we do not rule out the possibility of national lockdowns recurring (under second wave risks) – our base case for EM is no significant lockdowns, rather at most surgical/localised lockdowns to try and limit the economic fallout.
We also sense the political and electoral will in DM countries for widespread lockdowns has also reduced, which in our opinion may have long-term negative public health risks. As such reinforces our rationale for the strong overweight position in PPE stocks.
As with equity markets, economic activity globally has started to recover over the past 4 months. Year on year growth is still in decline, but sequential months are improving – in some cases sharply. By way of illustration the EM composite manufacturing PMI rose to 51.6 in August (back into expansion mode) and is well off the low of 36.3 recorded in April (see following chart). In terms of the individual country manufacturing PMIs it is interesting to observe that:
- Over August there was a recovery across most EM PMIs that we monitor, with the largest improvements from Brazil 58.2 to 64.7, South Africa 51.2 to 57.3 and Indonesia 46.9 to 50.8
- At August there are now 9/14 countries with PMIs above 50 – indicating sequential expansion (month-on-month)
- Indeed, this continues the sequential improvement from April when there was only one country above 50 (China) – all other EMs were in deep contraction zone.
- China’s PMI, which collapsed from 50 in January to 35.7 in February (below its GFC nadir) – bounced to 52 in March has pretty much held this level over the past four months.
- The key laggard remains Mexico, and while it improved over June and July its reading remains depressed at 41.3.
There were US$1bn of net subscriptions into the EM equity asset class over August – the second inflow in a row over the past 6 months. Total EM equity outflows for 2020 YTD stood at -US$42bn. EM bond funds continue to fare considerably better than EM equities with US$26bn of inflows over April to August. Total equity and debt redemptions at August YTD were -US$64bn – which is equivalent to the peak GFC outflows in late 2008.
PMI Composite Index (January – August 2020)
Includes Brazil, China, India, Indonesia, Malaysia, Mexico, Philippines, Poland, Russia, Sth Africa, South Korea, Thailand, Taiwan and Turkey
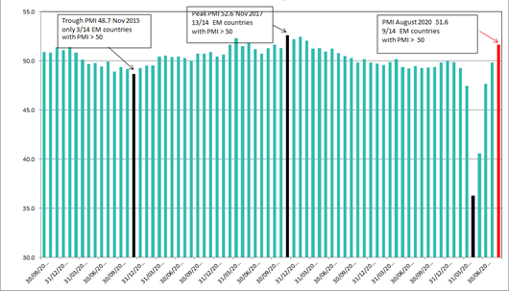
Source: Bloomberg, Northcape
These outflows have naturally had a serious negative impact on some EM currencies. Although the EM MSCI FX weighted index has fallen only -2% 2020 YTD and Asian currencies have been quite resilient, many others have been very weak 2020 YTD; BRL -27%, TRY -19%, ARS -19%, ZAR -17%, RUB -16% and MXN -14%.
Investors have generally moved funds back into safe havens, like the USD, JPY and EUR. However, we do note the USD has lost some steam in recent months (DXY index is down -10% from its 20 March high). This reflects investors seeing more value on a risk adjusted basis in other currencies, which in the case of EM offer much higher bond yields than US treasuries as we exit the initial (and fierce) COVID-19 exogenous shock. This has seen EM currencies stabilise and gain a bit of lost ground over the past 3 months (EM FX index +4% over past 4 months to July 2020).
We continue to note the deflationary forces of COVID-19 are material, by enlarging existing and creating new output gaps (primarily excess supply from mass labour shedding). The shock to income security is seeing households save a lot more, being much more careful, thrifty and risk averse. Higher saving rates, if sustained, are very negative for long-term consumption, investment and GDP growth and have a profound deflationary impact.
And when added to the structural deflation impact of aging demographics in advanced countries and relentless march of labour-saving digital disruption – inflation risks, globally are clearly to the downside. This is despite all the COVID-19 monetary stimulus, in our view, and implies the current low interest rates will be here for a long time.
Indeed, the US Federal Reserve has effectively pledged (and reiterates at every chance) its plan to target a policy rate at near zero for an “indefinite period” and is prepared to accept much higher levels of inflation (if indeed they occur).
EM Equity Funds Flow (US$bn) 2008 – 2020 YTD
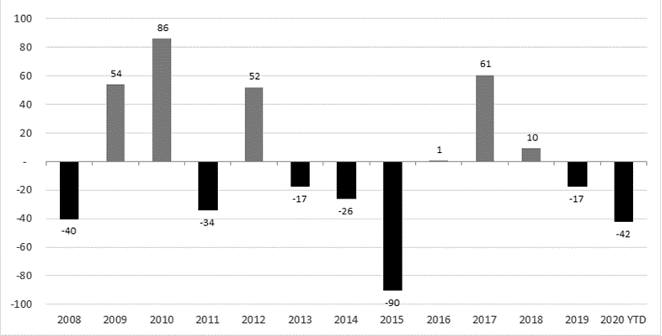
Source: EPFR Global
With deeper deflation risks, the average 10-year bond yield of the OECD countries has dropped from 45bps at end of March to 27bps at end of August. There were 9 out of 24 countries with a negative 10-year government bond yield at end of August (versus 5 countries with negative yield in March). On 2-year bonds the situation is even worse, given the average yield is “negative -28bps” and 17/24 OECD countries with a negative yield. The highest DM return comes from Australia’s 2-year bond yielding +24bps, with the lowest being Switzerland at -85bps!
Conversely, EM 10-year government bonds, (whilst yields have fallen over April to August -50-150bps on average) are still offering substantially higher nominal returns than the DM average of just 0.27%: South Africa 9%, Brazil, Russia, Indonesia, Mexico and India all still hovering between 5-7%, Philippines and Malaysia 2.5%. In our view, these high nominal and real yields should support fund flows back into EM capital markets when EM growth eventually stabilises. Indeed, we have started to see this trend emerge more strongly over the past two months.
Importantly, we stress again the onset of deflation and low bond yields will make those companies that can grow their cashflows in real terms over the long-term even more valuable.
This underscores the value an active fund manager can provide by essentially investing in EM companies that can “structurally grow” their cashflows in an environment of global deflation. Occasionally such coveted structural growth companies can be indiscriminately sold off during periods of liquidation – as we saw with the COVID-19 exogenous shock in March. We will continue to take advantage any future volatility to further lift our clients’ returns over the long-term by acquiring these companies at very attractive valuations.
Market Outlook and Portfolio Positioning
The world will inevitably deal with COVID-19, and economies will recover from current depressed levels. The challenge as stewards of our clients’ capital is to position the portfolio to benefit from not only superior company performance, but also the tailwind of economic growth.
In terms of our portfolio strategy going forward we remain collectively overweight India, Malaysia, Thailand, Mexico, South Korea, Taiwan and Indonesia, and underweight our assessed more riskier EMs such as Turkey, South Africa, Argentina, Russia, the Middle East and China. We think the former are collectively better placed to undertake policy responses to the growth shock from COVID-19 and subsequent economic slowdown, plus have added benefits of an array of good quality companies to invest in and stand to benefit from a growing share of foreign direct investment (as it pivots away from China).
There has been a marked correction in capital markets, followed by a very strong bounce over April to August. Downside risks are now more centred on countries that see a sharp reacceleration in the COVID-19 infection and death rates – thus forcing a secondary shutdown. This may cause sharp sell offs to some of our high-quality stocks. We will use these opportunities to add to these positions, especially when punished indiscriminately.
Our long-term base case view on China is unchanged, which is one of slowing growth as the country seeks to deleverage and further devaluation in the RMB. We believe the dispute with the US is likely to be only partly resolved at best and COVID-19 will have a lasting impact on China’s ability to attract FDI, debt and equity portfolio investment.
We may see many of China’s EM Index mega caps (currently listed in the US) being forced to relist elsewhere. This could be highly disruptive for the shareholder base and stock process. Our select few investments in China are focused on very high-quality companies with good governance, net cash balance sheets and have true global competitive advantages.
In terms of common themes from the bottom-up, we continue to covet companies with high returns on capital, and little or no debt. In fact, many of the companies on our Approval List and in the portfolio are “net cash”. This is a deliberate conservative strategy we adopt. Why?
In EM if there is an exogenous shock in financial markets – the ability to raise capital (debt or equity) can become near impossible for many companies. Accordingly, highly leveraged companies in EMs are at times extremely susceptible to selling their most prized assets at precisely the wrong time – at the bottom of an asset price cycle – the nadir! This risks permanent capital loss – a prospect we are not prepared to put our investors in front of. Indeed, recent EM geo-political events suggest that capital adequacy is becoming even more paramount.
We want to be positioned on the other side of this phenomenon. Owning the companies that are well placed to make opportunistic, yet sensible acquisitions from distressed sellers, from which they will create greater shareholder value over the years ahead. Or alternatively, pay more cash back to shareholders.
We still feel investors under-appreciate the capital adequacy and financial flexibility aspects of the stronger, quality companies of EMs on a long-term basis. We also prefer companies that address large populations with favourable demographics (one of the key attributes of EM), servicing industries that are growing structurally and are not highly cyclical.
Further, the companies in our portfolio are typically privately owned and have a tight focus on balancing stakeholder interests, whilst creating shareholder value. These companies also exhibit visible, robust internal cashflow generation – and generally can self-fund all their capital expenditure needs, as well as continue to pay attractive cash dividends from their retained earnings.
The Warakirri Global Emerging Markets Fund is long only, low turnover (30-50% p.a.) and selective. As such it will hold between 20-40 stocks. These stocks come from a concentrated “approved list” of at least 60 stocks of Emerging Market businesses with clear opportunities for growth. The Fund is focused on building real wealth over the long-term, by limiting downside risks, whilst capturing steady growth.
This information has been prepared by Warakirri Asset Management Ltd (ABN 33 057 529 370) (AFSL 246782) to provide general product information only and does not constitute financial advice as it does not take into account an individual’s personal circumstances and is not an offer or solicitation to enter into an agreement. Investors should not rely on the information in this document without first referring to the Fund’s Product Disclosure Statement (PDS) and Additional Information Booklet and seeking independent advice from their financial adviser. A PDS for the Fund is available at www.warakirri.com.au or by calling 1300 927 254. The PDS should be considered before making an investment decision. Investments entail risks, the value of investments can go down as well as up and investors should be aware they might not get back the full value invested. Northcape Capital (ABN 53 106 390 247) (AFSL 281767) is the underlying investment manager for the Funds. While the information included in this document has been prepared with all reasonable care, Northcape accepts no responsibility or liability for any errors, omissions or misstatements however caused. Portfolio holdings are subject to change.
![]()