Emerging Markets: A Retake on the Merits
22 May 2024

Equity markets have exhibited significant volatility since mid-2023. Despite some policy success lowering inflation well into last year, the pace of disinflation has since slowed markedly, causing authorities to reassess interest rates, undermining equity returns in the process. Geopolitical conflicts have added uncertainty. However, we continue to be enthused by the investment opportunities of EM. EM encompasses an extensive list of more than 4,000 listed companies, across 24 countries, representing a population pool of some 6 billion people and an asset class trading at a significant historical discount to US equities.
This information has been prepared by Northcape Capital, the underlying investment manager for the Warakirri Global Emerging Markets Fund.
The investing landscape
Equity markets have exhibited significant volatility since mid-2023. Stock market earnings for the recent March quarter offer a welcome update for investors seeking insight to current global corporate operating conditions. The return of elevated inflation and associated monetary policy tightening weighed heavily on equity markets over 2022. However, despite policy success lowering inflation well into last year, the pace of disinflation has since slowed markedly, causing authorities to reassess additional interest rate reductions, undermining equity returns in the process.
Equity market weakness in late 2023 has subsequently been superseded by a significant rally in stocks in 2024, led by gains in technology companies related to the euphoria surrounding the adoption of AI. More recently, geopolitical conflicts added uncertainty to the investment environment.
Investors are understandably asking, how is EM positioned in terms of price and opportunity?
The 1Q24 earnings results are generally performing well compared to expectations, with improved results from a year earlier. Positive surprises are being led by companies within IT and communication services, while companies in the materials and healthcare sectors have been relatively subdued. Management commentary has been generally constructive regarding near term revenue and profit potential.
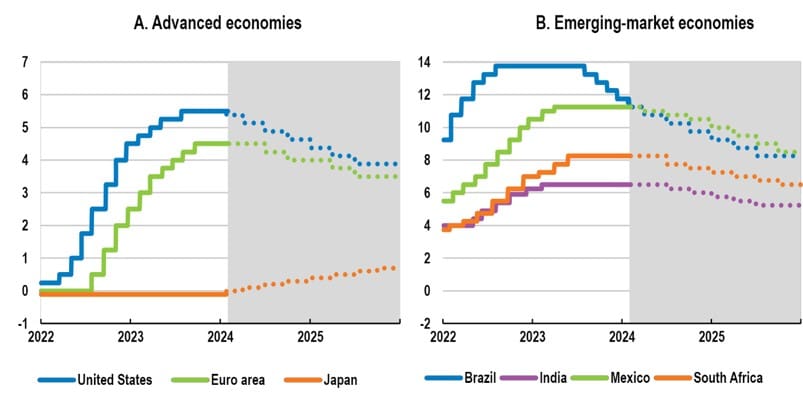
EMs are far outgrowing DM, led by India
According to the IMF, EM and developing economies GDP growth is forecast to be 4.7% for 2024, well above advanced economies at 1.7% (see Exhibit 1). Meanwhile China’s contribution to economic growth continues to contract, in line with decelerating domestic activity, a result of structural imbalances in the country’s real estate sector, local government and SOE indebtedness, poor demographics and geopolitical challenges, addressed in our prior reports.
Elsewhere in emerging Asia, India is forecast to achieve real GDP growth of 7% – making it the fastest-growing – a beneficiary of robust domestic demand and capital investment. Comparative real economic growth rates between India and China are notably distorted by China’s current deflation rate, as real GDP calculation excludes inflation.
China’s core CPI has been less than 1% for the past two years, and the country’s deflator turned negative for the past year (currently -1% over the year). The broad nature of the country’s pervasive deflation is evidenced by domestic producer prices contracting -3% from a year ago in April, close to the rolling average experienced since the beginning of 2023. Deflation lowers nominal GDP (current prices of goods and services), reducing the addressable revenue pool available to companies. Deflation is also associated with other economic challenges such as exacerbating the impost of excessive leverage, and typically lowering investment activity.
Exhibit 1: EM versus DM 2025 Real GDP Growth Forecast (%, equity market cap weighted)
Source: CLSA, Bloomberg.
This is resulting in a stark difference in the revenue growth opportunity between Northcape’s largest sovereign exposure India, whose nominal GDP is growing at around 13%, which dwarfs China’s c. 4%.
EM central banks have been more proactive
Global inflation decelerated from the demand fuelled and supply constrained COVID era, particularly over 2023, following concerted monetary policy tightening and supply chain recovery. Although goods inflation has eased, services inflation has proved harder to reduce, as the rate of decline in core inflation appears to not only have moderated but troughed above central bank target ranges.
The experience of past inflation cycles and associated currency pressures, led to early adoption of tighter policy and higher real rates by EM authorities when compared to many DM central banks. As a result, EM central banks, such as Brazil, India, Indonesia, Mexico, and South Africa enacted prudent policy successfully reducing inflation below their respective long-run averages, in contrast to the relatively restrained policy tightening by advanced economies, with the OECD G7 inflation rate still well above its historical average.
The pace of future monetary policy easing will depend upon the trend of inflation and other economic variables across countries. Encouragingly, the positioning of policy within EMs provides scope for lower rates, potentially offering authorities in EM policy flexibility should less restrictive policy be warranted (see Exhibit 2).
Meanwhile, fiscal policy has received comparatively scant attention relative to that of monetary policy. After the COVID-led stimulus era, governments have found it difficult to reduce their fiscal deficits – especially in DM.
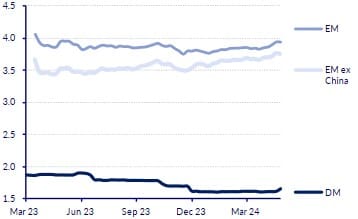
Exhibit 2: Percentage of Periods with Positive Returns over Different Holding Periods
Source: OECD Interim Economic Outlook
EMs have lower debt burdens than DM
Debt burdens continue to rise, problematic given elevated global debt, estimated by the Institute of International Finance more than 300% of GDP, in an environment of higher rates compared to the pre pandemic era. EM debt levels remain comparatively modest in absolute terms relative to DM countries.
CLSA estimate the proportion of EM corporate operating profit (EBIT) absorbed by interest expense to be now below that of DM, for the first time since 2013. EM’s relatively modest leverage position is even more pronounced when China is excluded, due the country’s elevated debt to GDP ratio approaching 300% (see Exhibit 3).
Exhibit 3: Percentage of Periods with Positive Returns over Different Holding Periods
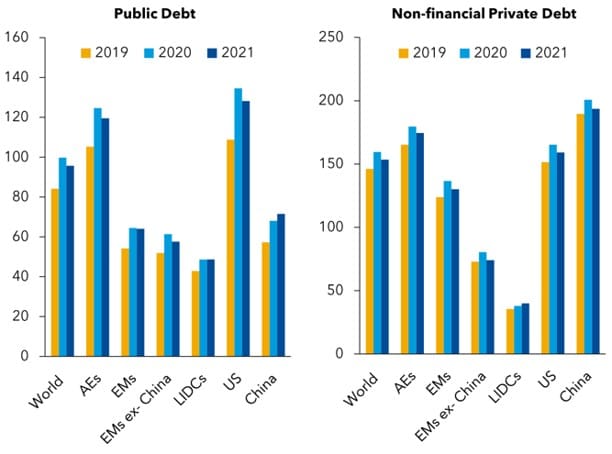
Source: IMF
EMs trade at a significant discount to DM
The favourable characteristics of EM for portfolio construction are further enhanced by active country and stock selection. We note global equity markets have been led higher over past years by US stocks, most recently dominated by large market capitalized technology companies. The degree of outperformance has resulted in a widening valuation gap between EM and other equity markets.
CLSA identify EM equities trading at a significant historical discount to US equities on a cyclically (long term, real earnings) Adjusted PE (CAPE) basis (see Exhibit 4). The EM CAPE, at 11x, is also well below that of the S&P500 at 33x.
Exhibit 4: EM & S&P500 CAPE (x) multiple
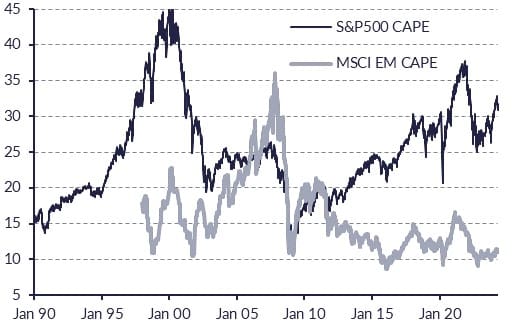
Source: CLSA, Refinitive
Conclusion
We continue to be enthused by the investment opportunities of EM. The asset class encompasses an extensive list of more than 4,000 listed companies, including 1,375 constituents of the MSCI EM index, across 24 countries, representing a population pool of some 6 billion people.
Northcape EM manages a high conviction strategy facilitating a best-in-class concentrated portfolio of less than 40 stocks. Fundamental company research, supported by extensive sector travel and sovereign analysis compliments critical risk management within the broader portfolio construction process.
The Northcape EM portfolio is valued at a reasonable 17x forward PE multiple, and though representing a premium to the benchmark’s 10x PE multiple, generates a 20% Return on Equity, well above the benchmark’s equivalent 12%. The sound fundamentals of the Northcape portfolio is evidenced by a third of the companies being unleveraged, in a net cash position.
For more information, please contact us on 1300 927 254 or visit the Warakirri Global Emerging Markets Fund page.
The information in this document is issued by Warakirri Asset Management Limited ABN 33 057 529 370 (Warakirri) AFSL 246782 and Northcape Capital ABN 53 106 390 247 AFSL 281767 (Northcape) representing the Northcape’s view on a number of economic and market topics as at the date of this report. Any economic and market forecasts presented herein is for informational purposes as at the date of this report. There can be no assurance the forecast can be achieved. Furthermore, the information in this publication should only be used as general information and should not be taken as personal financial, economic, legal, accounting, or tax advice or recommendation as it does not take into account an individual’s objectives, personal financial situation or needs. Investors should not rely on the information in this document without first referring to the Warakirri Global Emerging Markets Fund’s Product Disclosure Statement (PDS), Additional Information Booklet and Target Market Determination (TMD) and seeking independent advice from their financial adviser. A PDS for the Fund is available at www.warakirri.com.au or by calling 1300 927 254. The PDS should be considered before making an investment decision. Investments entail risks, the value of investments can go down as well as up and investors should be aware they might not get back the full value invested. Portfolio holdings are subject to change. You should form your own opinion on the information, and whether the information is suitable for your (or your clients) individual needs and aims as an investor. While the information in this publication has been prepared with all reasonable care, Warakirri and Northcape do not accept any responsibility or liability for any errors, omissions or misstatements however caused.
![]()